- Views: 1K
- Replies: 32
 XenFootprint – The 4-Level Visual Footprint System
Most footprint indicators show numbers.
Some add basic coloring.
XenFootprint is engineered around visual decision speed.

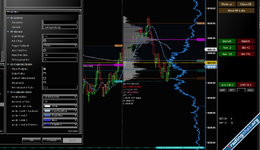
Its core advantage is a structured 4-Level Color Engine that transforms raw bid × ask data into instantly readable intensity zones — so traders can identify aggression, dominance, and imbalance strength without overanalyzing numbers.
 Designed for Visual Order Flow Traders
In fast markets, traders don’t have time to compare ratios manually.
XenFootprint automatically normalizes volume and delta data into four clear intensity levels:
 Level 1 – Light participation Level 2 – Moderate activity Level 3 – Strong participation Level 4 – Extreme aggression
This applies dynamically across visible bars, allowing the chart to adapt to current market conditions instead of relying on static thresholds.
The result:
✔ Faster decision making
✔ Clearer dominance recognition
✔ Reduced cognitive load
✔ Immediate identification of aggressive participation
 Volume Levels & Imbalance Levels
Two modes. Two different reads of the market. Volume Levels
Shows where participation was strongest inside the bar.
Use it when you want to spot:
 High-activity price zones Absorption areas Strong auction development Liquidity acceptance
Best for:
✔ Structure traders
✔ Auction market traders
✔ Scalpers watching intrabar volume
You instantly see where the market was active.
Imbalance Levels
Highlights aggressive dominance between buyers and sellers.
Use it when you want to spot:
Initiative buying Aggressive selling
⚔ Control shifts
 Momentum building
Best for:
✔ Breakout traders
✔ Momentum scalpers
✔ Stacked imbalance traders
You instantly see who’s pressing the market.
One-Click Activation
┌───────────────────────────────┐│ SHOW FOOTPRINT │ HIDE FOOTPRINT │
│ [Shift+Space] │ [Shift+Space] │
└───────────────────────────────┘
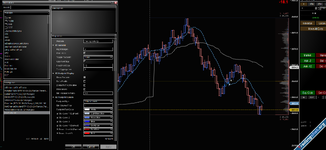
Toggle footprint view instantly with customizable hotkeys. Switch between regular charts and footprint view without losing your settings.
 Min Volume Filter – Cleaner, Smarter Footprint
Not every printed trade matters.
The Min Volume Filter removes low-volume noise by applying a minimum threshold to each price level.
 How It Works
If volume at a price level is below your defined threshold:➡ It is automatically displayed as Level 1 colour (lowest intensity)
➡ It does not get highlighted as significant activity
➡ It reduces visual clutter inside the bar
Only meaningful participation stands out.
 Other Key Features
 Tick Aggregation Control – Group price levels for cleaner structure and reduced noise. Integrated Session Volume Profile – Real-time POC, VAH, VAL with automatic value area calculation. Auto Chart Scaling Adjustment – Optimized bar width and spacing when footprint is enabled. Per-Bar Summary Statistics – Total volume, bar delta, cumulative delta tracking. Delta Profile Mode – Visual delta intensity inside each bar. Stacked Imbalance Detection – Identifies consecutive aggressive dominance zones. Cumulative Swing Delta – Tracks delta shifts across structural swings. Per-Bar Volume & Delta Toggle – Display key stats directly on the chart. Bottom Panel (Delta / Volume) – Histogram-style visualization below price. Hotkey Toggle (Show/Hide) – Instantly switch between footprint and regular view. Custom Scroll & Zoom Control – Smooth zooming with footprint layout preservation.
 Get Your License
Activate XenFootprint here: https://tradingchat.org/account/license
 Built with  for traders.
for traders.Attachments
Last edited: