- Views: 442
- Replies: 15
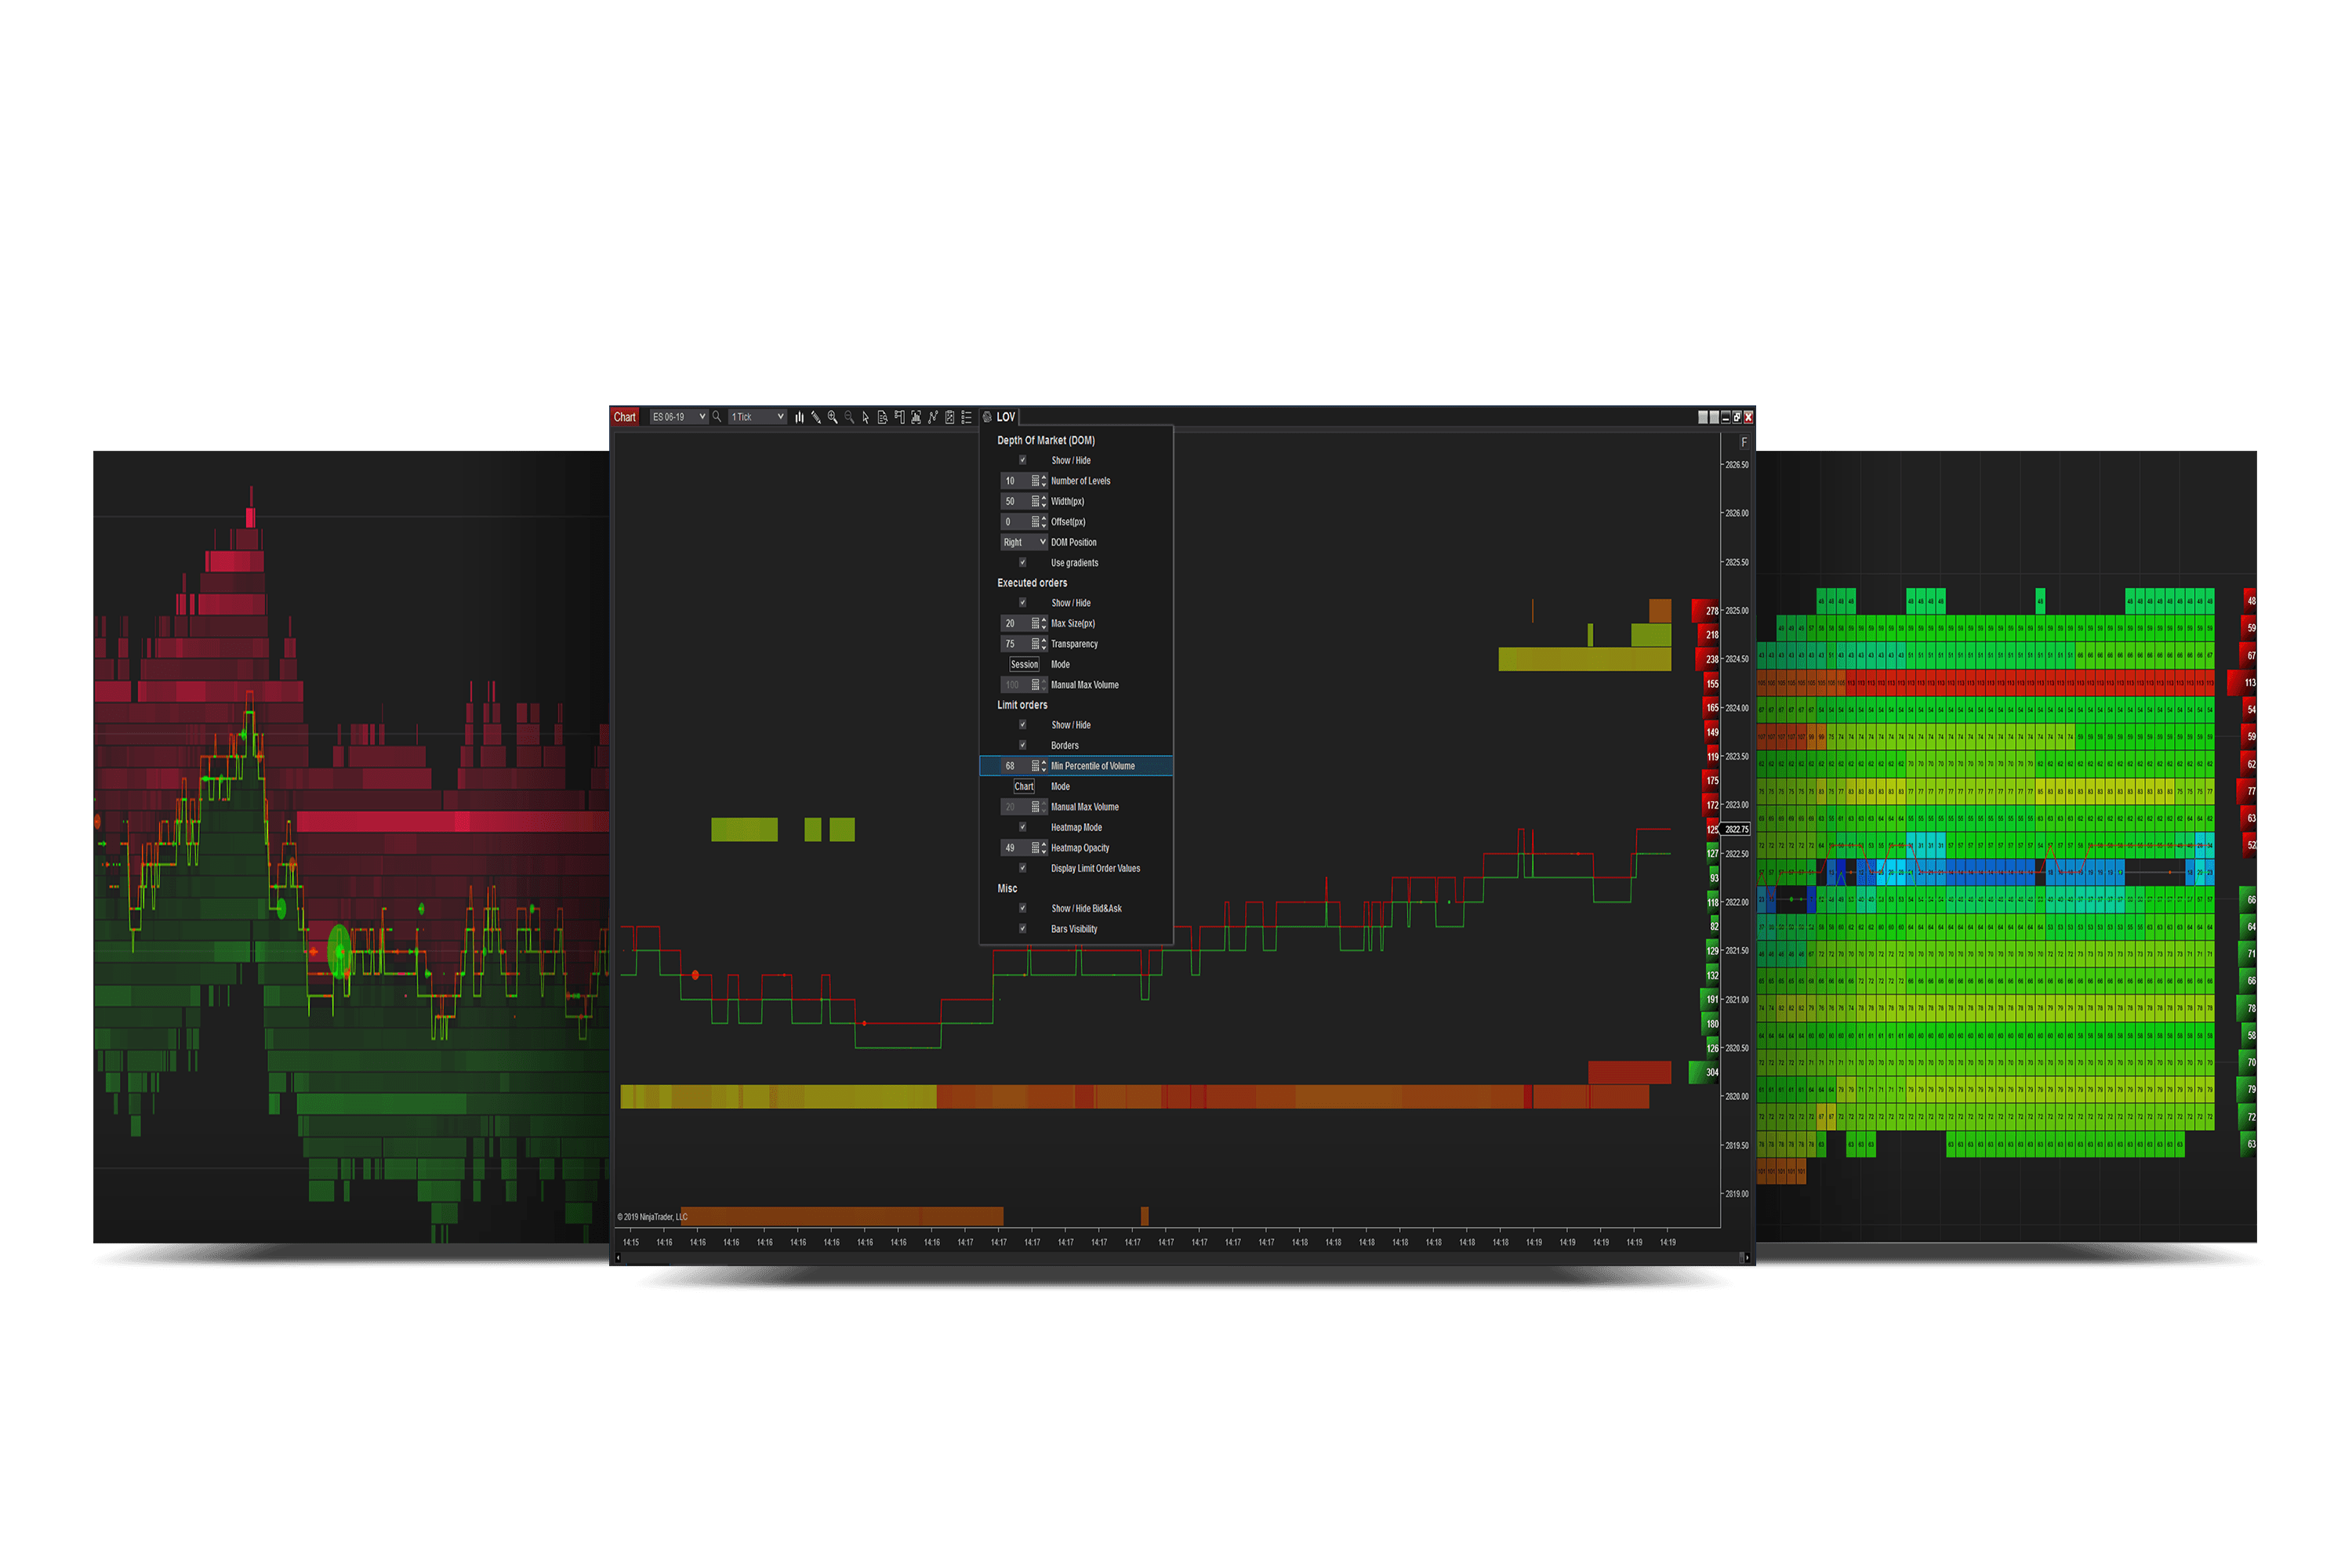
View in real-time the Orderbook, executed trades, limit orders, and the bid and ask spread. Change the settings without refreshing your chart. Add your favorite indicators to chart. Limit Order Visualizer is compatible with Market Replay, thus you can review Orderbook action on your charts!
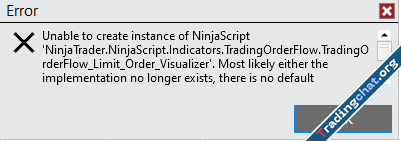
Limit Order Visualizer can display both historical market depth, saving data beyond a connection lost, new charts, duplicating charts and NinjaTrader’s shutdown or restarts. This means you can now make changes to indicators, change the time-frame , and even endure a lost connection without losing level 2 data.
Limit Order Visualizer (LOV) is the most sophisticated tool to analyze the Orderflow within NinjaTrader® Chart. Most noteworthy it allows you to view level 2 Market Depth in real-time and historically (whilst the indicator is running) while being able to change the setting in real-time. Thus, you can spot changes in the depth of the market that influence market participants and prices. By using the native NinjaTrader® Chart you can add your favorite indicators to the chart and analyze how the limit orders behave at your price levels. Limit Order Visualizer integrates into your chart so it adds a layer of information to your chart.
Spot massive orders entering the market and removed in real time. Limit Order Visualizer allows you to display and make changes on the fly depending on what you perceive are the circumstances to analyze:
- Orderbook on the right side of the chart;
- Executed orders and their relative size to each other depending on what visualization mode you prefer;
- Limit orders with a transparency setting that allows you to view only above a specified value;
- Limit Order Visualizer can help you see what are the intentions of market participants.
Features
View Market Depth activity and significant limit orders! Limit Order Visualizer can help you see what the intentions of market participants are.Change the settings in real-time without losing information. Adaptable to current session and chart view.
Limit Orders
View the Orderbook on the chart in real-time and adapt the display to suit your needs.
OrderBook
Spot the interaction of market participants.
Executed Orders
Customize your Volume Profile to provide all the analyses you need.
Limit Order Visualizer: Real-Time Orderbook & Trades Visualization
Enhance your NinjaTrader with Limit Order Visualizer. View real-time Orderbook, trades, limit orders, and spread. Customize settings without refreshing the chart.
 tradingorderflow.com
- Close Nt8
- Install Setup
- Copy the dll into Documents\NinjaTrader 8\bin\Custom
Attachments
Last edited: